Thursday, December 11, 2008

Chasing Performance

The end of 2008 is almost here.  For many investors that will be a welcoming event.  I think it's safe to say that most investors will be more than happy to put this year behind us.  

However, this reminds me of something else that is about to happen.  In January, you will start to see the "Best of 2008" lists.  These are the lists that rank the top performing stocks, ETFs, and mutual funds for 2008.  This happens every year.  Investors see these lists in Money, Fortune, SmartMoney, The Wall Street Journal, The USA Today, and so on.  

Mutual fund investors will often compare these top performers with their own mutual fund holdings and get frustrated.  Acting out of emotion, they will sell their current holdings and "chase" performance by buying the funds on the "top performers" list.  Usually, this is a HUGE mistake.  Here's why: More often than not, today's winners will be tomorrow's losers.  

Here is a case in point: Legg Mason Value Trust (LMVTX).  This fund's manager, Bill Miller, spent nearly two decades building a reputation as one of the greatest mutual fund managers ever.  He consistently outperformed the S&P 500 year after year.  Then, in one year, his track record took a major hit.  Here is an excerpt from an article in yesterday's Wall Street Journal profiling the fund's fall from glory:
A year ago, his Value Trust fund had $16.5 billion under management. Now, after losses and redemptions, it has assets of $4.3 billion, according to Morningstar Inc. Value Trust's investors have lost 58% of their money over the past year, 20 percentage points worse than the decline on the Standard & Poor's 500 stock index.

These losses have wiped away Value Trust's years of market-beating performance. The fund is now among the worst-performing in its class for the last one-, three-, five- and 10-year periods, according to Morningstar.
Here are a few lessons learned from this example:
  1. Just because a fund has consistently been a top performer in the past doesn't mean it will always be a top performer in the future.
  2. Every great money manager will have a period of underperformance.
  3. Investor's who "chased" performance by buying the fund anytime in the past 10 years now have a loss.
There is much more to mutual fund selection than last year's performance.  In addition to performance, there are 3 other P's you must understand about a mutual fund:
  • Philosophy - How does the manager approach investing?  Try to understand exactly what the manager is looking for in an investment.   Spend as much time as you can seeking to understand the manager's investment criteria. 
  • Process - How does the manager execute his or her philosophy.  What are the steps the manager takes to narrow down the vast universe of investment opportunities?  How does the manager identify the most attractive investments to be included in the fund portfolio?
  • People - What is the manager's experience and prior track record?  What is the quality of the research team that supports the manager?

Thursday, November 27, 2008

10 Things I'm Thankful For

I love Thanksgiving.  I love the food, and I love the time with family and friends.  But, I also love the spirit behind the day...an attitude of gratitude.  

You see, with all the negative news about the economy and stock market it's easy to forget the good things in life.  It's not intentional.  It's just that the negatives in life seem to build this cloud over all the positives not allowing us to see life with a clear perspective. 

However, when you take the time to step back and think about it...life isn't so bad.  In fact, if you are living in the United States of America you have a lot to be thankful for even when the economy is in a recession and the stock market is struggling.

I have A LOT to be thankful for.  Here are just 10 things that come to mind:

  1. Family & Friends.  I have a great family and many wonderful friends!  No explanation needed.  Everyone knows what a blessing it is to have family and friends.
  2. Living in the USA.  Yes, today our economy is in a recession.  Since 1926, we have been through 14 recessions.  In all cases, the economy eventually recovered and the stock market went on to reach new highs.  Our country is resilient.  Freedom, opportunity, and determination have enabled Americans to make our world a better place.  I'm glad I get to be part of that.
  3. An opportunity to buy stocks at cheap prices.  The recent crash in the stock market has created an opportunity to buy stocks at levels rarely seen in an investor's lifetime.  If you're investing for a goal 10 years or more from now, then you don't want to miss this opportunity.  I see some high quality businesses with strong finances where the stock is now trading at value prices. 
  4. Our firm's new investment strategy, the Global Trends Strategy.  This strategy is designed to participate in rising trends and be on the sidelines when there are none.  The strategy is working!  
  5. Dividends.  When investing in individual stocks we prefer to invest in companies that pay dividends.  Dividends are especially nice when stock prices are declining.  We have retired clients who are living off their dividends.  Although the drop in price for the stocks they own is no fun to watch, it's the dividends that keep them invested.  Without dividend income what would they live on?
  6. Technology & the Internet.  I recently moved to South Carolina.  Technology has enabled me to continue to work seamlessly with the team in Ohio and stay in touch with our clients.
  7. Clients.  I wouldn't have the opportunity to do what I love without our clients.  Our firm has many loyal clients who have placed their trust and confidence in us.  I am honored to work for every one of them.
  8. The team of people I get to work with.  They are fun to be around and great at what they do.
  9. The invitation from some new friends to join them at the Clemson vs. South Carolina football game this Saturday.  Go Tigers!
  10. Did I mention family and friends?
I could certainly go on all day about the things I'm grateful for.  How about you?  Do you have an appreciation for the good in life, or are you stuck on all the things that aren't perfect?  There is no better time than now to re-focus your perspective on life.  Refuse to participate in all the "Oh, no! We are in a recession, and we are headed for The Great Depression 2.0!" talk.

Happy Thanksgiving!

Wednesday, November 26, 2008

The Strategy Works

On July 1, 2008 our firm launched a new investment strategy, the Global Trends Strategy.  The investment approach is simple:
  1. Identify sustainable trends.
  2. Invest in those trends via ETFs.
  3. Adapt quickly when those trends change.
  4. When unable to identify a sustainable trend, wait in cash.
The strategy is designed to participate in rising trends and be on the sidelines when there are none.  The strategy is working!  On September 18th the portfolio was 90% in cash.  The Dow closed at 11020 that day.  By October 16th the portfolio was 100% cash and has been ever since.  As I write this the Dow is now trading around 8500.  In other words, the market is now 23% BELOW the level at which we began selling our positions.  Our risk management rules told us it was time to be in cash.  The decision to be in cash has protected us from the painful crash in the market as well as "the worst week ever".

On October 3rd (with the Dow at 10325) I wrote "Cash Is King...For Now".  My main point with that post:
If you've been executing a trend following strategy, then by now you should be in cash and you should stay in cash until new trends are established. 
Cash is still king for trend followers that are looking for sustainable rising trends.

[DISCLOSURE: Clients of Freedom Financial Solutions, LLC that are invested in the Global Trends Strategy currently have a cash position of 100%.]

Thursday, October 23, 2008

Understanding the Financial Crisis in Less Than 3 Minutes

Here is a nice video via Enspire Learning that provides an explanation for the financial crisis:


Obviously, it is more complicated than a 2 minute and 17 second video can explain. However, the video is well-done and tackles the root of the problem.

I like short and simple explanations like this. How about you? Have you found videos or visuals that explain the current financial crisis in short, simple, and easy to understand terms? If so, feel free to post your links in the comments to this post.

Friday, October 17, 2008

New Stock Market Terms

Some Friday afternoon fun originally posted by Barry Ritholtz at The Big Picture:
A fun email circulating trading desks, worthwhile as an informal measure of sentiment:

CEO -- Chief Embezzlement Officer.

CFO -- Corporate Fraud Officer.

BULL MARKET -- A random market movement causing an investor to mistake himself for a financial genius.

BEAR MARKET -- A 6 to 18 month period when the kids get no allowance, the wife gets no jewelry, and the husband gets no sex.

VALUE INVESTING -- The art of buying low and selling lower.

P/E RATIO -- The percentage of investors wetting their pants as the market keeps crashing.

BROKER -- What my broker has made me.

STANDARD & POOR -- Your life in a nutshell.

STOCK ANALYST -- Idiot who just downgraded your stock.

STOCK SPLIT -- When your ex-wife and her lawyer split your assets equally between themselves.

FINANCIAL PLANNER -- A guy whose phone has been disconnected.

MARKET CORRECTION -- The day after you buy stocks.

CASH FLOW -- The movement your money makes as it disappears down the toilet.

YAHOO -- What you yell after selling it to some poor sucker for $240 per share.

WINDOWS -- What you jump out of when you're the sucker who bought Yahoo @ $240 per share.

INSTITUTIONAL INVESTOR -- Past year investor who's now locked up in a nuthouse.

PROFIT -- An archaic word no longer in use.

Monday, October 13, 2008

The Worst Week Ever

Last week was the worst week ever in the U.S. stock market. For the week, the S&P 500 and the Dow both crashed -18.20%! I survived! If you are reading this, then chances are...you survived too!

The Facts

Let's review what just happened:
  • Last Friday, stocks endured the widest intraday swing on record. For the first time ever, the Dow traded in a range of more than 1,000 points in a single day.
  • Trading activity hit new records on Friday. The New York Stock Exchange composite volume hit 11.6 billion shares, a new record. Nasdaq trading also hit a record, as 4.18 billion shares changed hands.
  • For the week, the Dow dropped 1,874.19 points, or 18.2%. This was the worst week in its 112-year history.
  • The Dow closed the week at 8451.19, the lowest finish since April 25, 2003.
  • Stocks indexes have closed down 8 days in a row.
  • Stock market losses (in the DJ Wilshire 5000 Index) now total $8.4 trillion since the market peak one year ago.
  • The Dow is now down 40% from its October, 2007 peak.
  • The VIX, a measure of fear based on options trading, rose to 69.95, its highest level since it was introduced over 15 years ago.
Sources: Wall Street Journal, Investors Business Daily

How Did This Happen?

Do you wonder how we got here? Read this article which appeared in the New York Times on September 30, 1999. Here are a few highlights from the article:
Fannie Mae, the nation's biggest underwriter of home mortgages, has been under increasing pressure from the Clinton Administration to expand mortgage loans among low and moderate income people and felt pressure from stock holders to maintain its phenomenal growth in profits.

In addition, banks, thrift institutions and mortgage companies have been pressing Fannie Mae to help them make more loans to so-called subprime borrowers. These borrowers whose incomes, credit ratings and savings are not good enough to qualify for conventional loans, can only get loans from finance companies that charge much higher interest rates -- anywhere from three to four percentage points higher than conventional loans.

In moving, even tentatively, into this new area of lending, Fannie Mae is taking on significantly more risk, which may not pose any difficulties during flush economic times. But the government-subsidized corporation may run into trouble in an economic downturn, prompting a government rescue similar to that of the savings and loan industry in the 1980's.

''From the perspective of many people, including me, this is another thrift industry growing up around us,'' said Peter Wallison a resident fellow at the American Enterprise Institute. ''If they fail, the government will have to step up and bail them out the way it stepped up and bailed out the thrift industry.''

From about 1998 to 2006 home prices grew at an 8% annualized rate (source: Robert Shiller). Many in America began to operate under the assumption that house prices would always go up. Well, as we found out, that's not true. The housing bubble popped! As the housing market has declined, over leveraged families and banks holding assets related to home mortgages have suffered significant losses. As a result of these losses, many banks lack the capital or the confidence in each other to make new loans. This has now led to frozen credit markets.

The bottom-line is that massive leverage is what got us here. The problems resulting from years of growth in the amount of debt relative to the size of the overall economy has now infected the global financial system. Financial institutions, hedge funds, and households are being forced to reduce debt (deleverage) all at the same time. This results in forced sales because as asset values start to decline, leveraged investors must raise more capital. To do so, they sell what they can putting more downward pressure on asset prices. Another consequence this has created is a lack of capital in the banking system.

What's The Solution?

At the moment, credit is essentially frozen and a world-wide recession seems almost inevitable. However, we won't have a 1930s style depression if we look forward and tackle this crisis head-on. The solution to the present crisis will involve substantial deleveraging and a recapitalization of our financial institutions.

Beyond the immediate problem, we need to see a bottom in housing prices. A key problem in the housing market is inventory: The supply of homes simply exceeds demand. And as a result, home values have declined. Once supply and demand balance out, our housing market will be able to recover, and that will help our broader economy begin to grow.

Finally, we will need lots of patience as it will take some time to fix these problems. Will this process be easy? No! But, can we fix it? Yes!

Let's Get Bullish On America: Remember...It's AmeriCAN, not AmeriCAN'T

Turn on the TV or read the newspaper and you are overwhelmed with negativity and a sense of panic. Sentiment is terrible and satisfaction is at an all-time low. According to CNNMoney.com, 60% of Americans think a depression is likely. Time magazine's latest issue has a picture of a soup line from the Great Depression era on the cover. You know there's panic when Jim Cramer says its time to get out of the stock market. There's even a new blog out: Sad Guys on Trading Floors. I agree with Barry's thoughts on this new blog: "Its funny and sad and poignant, but for our purposes, its a yet another in a list of contrary indicators that suggests things are getting overdone, and that sentiment is moving towards an extreme. A blog such as this could only be conceived of during times of extreme market stress."

We must change the mood in America. Without a doubt these are extraordinary times, and America is facing a crisis. Let's respond with optimism! I am bullish on America, and you should be do. We have faced times of crisis and uncertainty before and we've not only survived, but we've thrived.

To get you started thinking more positively take a look at Barry Ritholtz's recent post: 10 Bullish Charts, Signals, Indicators.

What To Do Now?

We don't have any evidence yet that we have hit a bottom in the stock market. However, with the Dow now down 40% from its peak we should be getting close. It is certainly possible for this market to go lower and trends often last longer than you expect. However, the best opportunities in the history of the stock market came during periods of crisis and panic. As Warren Buffet has said, "good investors are fearful when everyone else is greedy, and greedy when everyone else is fearful.”

Just because the stock markets have panicked doesn't mean you should. Now is not the time to abandon your investment strategy. You do have a strategy, right? If not, now is the time to develop one. Some great opportunities lie somewhere ahead. Crisis creates opportunity. This crisis is in the process of creating some "once in a lifetime opportunities." You won't want to miss out. Don't quit now. If you do, you will regret it.

If you are young and stashing money away on a regular basis, then stay the course. If you are approaching or are in retirement, then now is not the time to decide to get more conservative with your asset allocation or investment strategy. Don't let an emotionally driven decision destroy your retirement prospects.

Don't fall into panic mode as many others already have. To succeed you will need to be 1.) PATIENT, 2.) DISCIPLINED, and 3.) CONFIDENT.

Are you overwhelmed by "the worst week ever"? Are you unsure of how you should respond to the current crisis? Have you wandered if your investment strategy is sound? Maybe you're just tired of managing your own money? Or, do you find that there's simply not enough time or desire to do the work? If you have $100,000 or more of investable assets, then I can help! My firm can manage your money for you. Contact us to see how we might be able to help you.

Friday, October 3, 2008

Cash is King...For Now!

Fear has spread throughout Wall Street and Main Street. One consequence of all the fear on the Street is the lack of sustainable positive trends.

As the heading on this blog states I believe that "There's always a bull market somewhere!" In other words, I believe that at any point in time there is always a broad market index, a sector, an industry group, a country, an asset class, a commodity, or a currency that is in a rising trend. For instance, the first six months of this year stocks in the U.S. and across the globe were down. However, the price of oil was up, commodity prices were up, and precious metals were up. You could have generated some nice returns during the first half of 2008 by avoiding stocks and investing in USO (oil), GSG (commodities), GLD (gold), and SLV (silver). However, in July the trends in all of those asset classes turned bearish. Trend followers would have exited those positions only to find a lack of sustainable trends elsewhere.

The third quarter of 2008 was marked by fear and panic as the credit crisis and collapse of financial institutions roiled the markets with uncertainty. But remember, fear and panic is what it will take to establish a bear market bottom that lasts. Everyone would like to know where the bottom of this market is or how long the bear market will last. The answer is: no one knows. Changes in market trends and the duration of those trends can not be predicted in advance. As a trend follower, all I can do is identify current trends and follow them. What I do know is this: CASH IS KING...FOR NOW!

Here are a few trend following principles to keep in mind:
  1. Don't fight momentum; embrace it! Trends often last longer than people expect. It is more likely that a trend will continue rather than reverse. The path of least resistance is most often the current path of the trend. Always assume a trend will continue until you have proof (from charts and technical analysis) that it has reversed.
  2. Trends reverse quickly. Just review the charts for the ETFs I mentioned above. You will see that although they were all in rising trends during the first half of this year, they all reversed sharply in July and August. The trend is your friend...until it isn't! You must have an exit strategy. Know your sell rules and follow them.
With those principles in mind it's important to remember that the current trend for almost everything is DOWN. Until there is more certainty related to the credit crisis and problems in the banking industry, don't fight the downside momentum. If you've been executing a trend following strategy, then by now you should be in cash and you should stay in cash until new trends are established.

[DISCLOSURE: Clients of Freedom Financial Solutions, LLC that are invested in the Global Trends Strategy currently have a cash position that ranges from 90% to 100%.]

Thursday, September 4, 2008

Trend Review: US Sectors

Let's take a look at the long-term trends for the 10 major US sectors. For this review we will be looking at 3-year weekly charts. I like the weekly charts when reviewing long-term trends because they eliminate a lot of the noise we get with daily volatility. It's important to step back and look at the big picture during times of choppy market action like we've seen this summer.

Each weekly chart will show the price and volume action along with the 10-week and 40-week moving averages. For this review I will analyze each sector long-term trend by identifying where the price is in relation to the 40-week moving average which acts as a long term trend line.

Financials (XLF)


  • -27.2% YTD
  • TREND = DOWN. Financials, by far, have been the worst performing sector in the market this year. The primary trend for financials remains firmly down. I don't expect a trend reversal anytime soon. See my previous post for a deeper review on financials, and the signs I will look for to turn bullish.
Energy (XLE)


  • -13.42% YTD
  • TREND = DOWN. Energy stocks had a nice run until the end of June. The surge in the price of oil certainly contributed to that. However, after peaking, oil has plunged and energy stocks are currently in a down trend. The price is below both the 10-week and 40-week moving average. The 10-week average recently crossed below the 40-week which is a bearish signal.
Consumer Discretionary (XLY)


  • -7.58% YTD
  • TREND = DOWN. XLY is actually trading slightly above the 10-week moving average which makes it a rising trend on an intermediate time frame. However, it's still trading below the 40-week moving average which was a point of resistance in April. Consumer Discretionary typically underperforms during weak economic environments, so I have no reason the trend will reverse anytime soon.

Technology (XLK)


  • -19.28% YTD
  • TREND = DOWN. Technology stocks had a powerful run from mid-2006 to the end of 2007. XLK turned bearish at the beginning of the this year, and the trend failed to reverse when the 10-week moving average failed to cross above the 40-week moving average this summer.
Health Care (XLV)


  • -9.32% YTD
  • TREND = NEUTRAL, BUT TURNING BEARISH. XLV fell below the 40-week moving average just today. Health care stocks were leaders of the market in July and August, but have struggled more recently. In fact, it seems that XLV turned down right after my previous post highlighting the strength of the sector. Perhaps some of the political risk is now weighing on the group as we approach November. This sector should be watched closely over the next few days to see if the trend is truly reversing, or if the 40-week moving average will act as support.
Materials (XLB)


  • -10.84% YTD
  • TREND = DOWN. Materials stocks turned down this summer after a powerful bull market that began in late 2005.
Industrials (XLI)


  • -13.76% YTD
  • TREND = DOWN.
Consumer Staples (XLP)


  • -2.57% YTD
  • TREND = UP. Consumer Staples stocks have shown resilience as they have provided the best return relative to other sectors for the year. This is to be expected during recessionary times or periods where the economy has slowed. A quick review of the top 10 holdings of XLP (see table below) provides a good explanation for the relative strength of this sector: Even during an economic slowdown consumers will still buy deodorant (thankfully!), shampoo, toothpaste, razors, coffee, food, cigarettes, soft drinks, pharmaceutical products, beer, and snacks.

Telecom (TTH)

  • -23.62% YTD
  • TREND = DOWN.
Utilities (XLU)


  • -14.6% YTD
  • TREND = DOWN.

THE UPSHOT: The US stock market has offered no where to hide this year as every sector has negative year-to-date returns. The only sector where we can identify an UP trend is in Consumer Staples (XLP). Health Care (XLV) is now on WATCH as it was recently in an UP trend but now appears that it is turning DOWN. I believe that there is always a bull market somewhere! The first half of this year, the bull market was in oil, commodities, and precious metals. In July and August the bull market was in health care. This year the bull market has been in short or inverse ETFs. Sometimes the bull market is cash. Cash is king during environments like this where money is rotating between sectors and asset classes. New trends are forming and somewhere ahead we will identify some amazing new bull markets. Cash will enable you to jump on these new trends very quickly once the transition is complete.

[DISCLOSURE: Some clients of Freedom Financial Solutions, LLC and/or Adam Zuercher's family accounts own shares of XLV and XLP.]

Tuesday, August 26, 2008

10 Secrets to Success

Investor's Business Daily (IBD) has become a great resource for me and should be on every investor's reading list. If you aren't familiar with this daily newspaper I encourage you to go to their website and sign up for a free trial. I like the paper because it contains an abundance of relevant information on a daily basis.

In addition to the excellent coverage of the stock market the paper does a great job of pointing out some of the best leaders in business. IBD has spent years analyzing leaders and successful people in all walks of life. Most have 10 traits that, when combined, can turn dreams into reality. Each day, on the Leaders & Success page, the paper will highlight one of those traits.

Here are IBD's 10 Secrets To Success:
  1. HOW YOU THINK IS EVERYTHING: Always be positive. Think success, not failure. Beware of a negative environment.
  2. DECIDE UPON YOUR TRUE DREAMS AND GOALS: Write down your specific goals and develop a plan to reach them.
  3. TAKE ACTION: Goals are nothing without action. Don't be afraid to get started. Just do it.
  4. NEVER STOP LEARNING: Go back to school or read books. Get training and acquire skills.
  5. BE PERSISTENT AND WORK HARD: Success is a marathon, not a sprint. Never give up.
  6. LEARN TO ANALYZE DETAILS: Get all the facts, all the input. Learn from your mistakes.
  7. FOCUS YOUR TIME AND MONEY: Don't let other people or things distract you.
  8. DON'T BE AFRAID TO INNOVATE; BE DIFFERENT: Following the herd is a sure way to mediocrity.
  9. DEAL AND COMMUNICATE WITH PEOPLE EFFECTIVELY: No person is an island. Learn to understand and motivate others.
  10. BE HONEST AND DEPENDABLE; TAKE RESPONSIBILITY: Otherwise, #s 1-9 won't matter.

THE UPSHOT: What a great list of leadership traits! I couldn't have written the list any better. It is this combination of traits that I strive to execute in my life. You can turn dreams into reality by executing these traits.

Monday, August 25, 2008

McCain & Obama Tax Plans

This week's cover article in Barron's compares John McCain's and Barack Obama's tax plans. Each plan has different implications for the U.S. economy. This is recommended reading before you vote. The article is available here for free.

Table courtesy of Barron's

Thursday, August 21, 2008

Healing an Ailing Stock Market

Over the last 3 months health care stocks have offered a cure for the sick stock market. The chart below (courtesy of FINVIZ.com) shows that the health care sector has been the only sector to offer positive returns for the past 3 months.

The next chart compares the Health Care SPDR (XLV) with the S&P 500 SPDR (SPY) over the last 3 months.

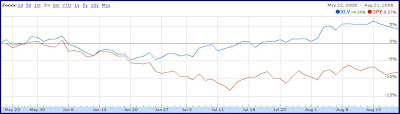
The health care sector has clearly outperformed the broad market with a positive return for XLV of 4.3% versus a negative return for SPY of -8.3%. In other words, the health care sector ETF has outperformed the S&P 500 ETF by 12.6% over the last 3 months.

As I like to say, "There's always a bull market somewhere!" These days, it has admittedly been a challenge to find an abundance of bullish trends as the market has been rather choppy lately.

Take another look at the chart above. You will see that most of the gains in health care have been generated since late July. Let's take a look at a 1-year weekly chart of XLV:


  • As indicated by the blue trend line, XLV started rising in July. The price crossed both the 10-week and the 40-week moving averages by early August.

  • The volume has been strong. We saw price increases on rising volume in four out of the last nine weeks. Seven out of nine weeks were positive, and the two weeks with price declines have shown volume lower than the previous weeks. All of this points to a rising trend with healthy volume.

Now take a look at the daily chart for XLV:


  • This week we have seen some selling on higher than average volume. The price has pulled back a little bit, but remains above both the 50-day and 200-day moving averages.

THE UPSHOT: Health care is in the beginning stages of a bull market. Is the the trend sustainable? Will it continue? Trend followers always take the position that a trend is your friend until proven otherwise. In other words, I don't know what the future will bring. However, I can identify trends that are present today. Since trends always last longer than you think, you should operate on the assumption that a trend will continue until proven otherwise. You must look for bullish indicators and signs that the trend will continue. Be cautious when you see signs that a trend might be close to reversing. The key going forward for the health care ETF (XLV) will be the July trend line and the 40-week moving average. Today it is testing it's July trend line as well as the 40-week moving average. Look for the 40-week moving average to act as support for this trend to continue. If the price bounces off the trend line and the 40-week moving average this would be another sign of a bullish trend with the potential to be sustainable.

[DISCLOSURE: Some clients of Freedom Financial Solutions, LLC and/or Adam Zuercher's family accounts own shares of XLV.]

Thursday, August 7, 2008

Outwork Your Competition

Earlier this week I was talking to a friend who was about to speak to our local high school football team. The takeaway from his message was going to be that success requires an attitude that you will outwork your competition. Winners outwork their opponents. Not just on game day, but everyday. In order to be the best football team in the conference every player on the team must come to each practice 100% committed to outworking the opponent. Success takes work. Hard work produces winners.

As I thought about this I realized how similar this philosophy is to investing. I was reminded of what William O'Neil said in his book, How to Make Money in Stocks:

Many long evenings of study led to precise rules, disciplines, and a plan that finally worked. Luck had nothing to do with it; it was persistence and hard work. You can't expect to watch television, drink beer every night, or party with all your friends and still find the answers to something as complex as the stock market or the American economy. In America, anyone can do anything by working at it. If you get discouraged, don't ever give up. Go back and put in some detailed extra effort. It's always the study and learning time you put in after nine to five, Monday through Friday, that ultimately makes the difference between winning and reaching your goals or missing out on truly great (and profitable!) opportunities.

This is great advice from two people whom I highly respect. You can't expect to succeed with your investments without doing your homework. To truly understand the markets and to exploit trends you've got to do some work. Spend some time reading how others have been successful. Study charts, price action, and company fundamentals. Learn what works and what doesn't. And most importantly, be sure you understand what NOT to do. Have a plan and set some rules regarding buying, selling, and risk management.

Sound overwhelming? Don't have the time or desire to do the work? That's fine. My firm can do it for you. Contact us to see how we might be able to help you.

Wednesday, July 30, 2008

Bullish on Biotech

Biotech is a hot sector right now and should quickly become a new focus for trend followers. My favorite way to track the trend in biotech is with the sector ETF: iShares NASDAQ Biotechnology Index (IBB). Through yesterday this fund is up 7%, outperforming the S&P 500 by 20%. For the trailing 12 months the fund has beat the S&P 500 by 24% with a return of 13%.

Let's take a look at some charts. First, we will review the weekly price and volume action for one year:


I like to look at weekly charts when trying to identify long-term trends because they filter out alot of the noise we pick up with daily price action. Here are my observations on the above chart:
  • IBB is currently trading around 86 which is up almost 25% from the March low of 69.43.
  • The 52-week high for IBB is 89. This peak came along with the broad market making new highs last October.

  • After the March low, IBB began building a nice base to setup a rising trend that began in early July.

  • Notice the following key events in the price action at the beginning of July: 1.) The price broke out above both the 10-week and the 40-week moving average. 2.) The shorter term moving average (the 10-week) crossed over the longer-term moving average (the 40-week). 3.) The slope of the moving average turned up. 3.) The weekly prices have been positive on increasing volume.
The daily chart below confirms the bullish trend in IBB:

As the charts indicate, there is clearly a bull market in biotech. Trend followers may want to consider entering a position on a pullback in price. The price is extended well above the moving averages and a pullback is likely. However, it should be noted that biotech is a very volatile sector and any new positions taken in IBB should be done with caution. See the chart at the end of this post to get a clear picture of the volatility in this sector.

The key is to have a plan. Have clear rules that dictate when to get in and out of your positions. Don't buy IBB based on this post alone. I've given you an investment idea to consdier, but ultimately you must do your homework and follow your purchase rules. Don't have the time or desire to do your own research? That's fine. My firm can do it for you. Contact us to see how we might be able to help you.


[DISCLOSURE: Some clients of Freedom Financial Solutions, LLC and/or Adam Zuercher's family accounts own shares of IBB.]

Thursday, July 24, 2008

Is WIND a Trend?

With the price of oil surging (see previous post) and some arguing that we have hit peak supplies of oil it is time to develop alternative energy sources.

In 1970, we (United States) imported 24% of our oil. Today, it's nearly 70% and rising. As oil prices rise, we are sending massive amounts of wealth out of our country. The US represents just 4% of the world's population, but we use 25% of the world's oil demand. According to T. Boone Pickens, America is addicted to foreign oil and it's time to look at other sources of energy. Mr. Pickens predicts that oil prices will hit $300 a barrel in 10 years if the United States fails to reduce its dependence on foreign imports.

Mr. Pickens has a plan. The plan promotes alternatives to oil, including natural gas, wind, and solar. A major feature of the plan is replacing the electricity that the United States gets from natural gas with WIND energy. This would then allow that natural gas to provide 38% of the States' fuel for transportation and reduce its dependence on foreign oil.

The Pickens Plan calls for the United States to leverage its wind corridor in the middle of the country which stretches from Texas through the great plains to the Canadian border. The Great Plains states are home to great wind energy potential. The Department of Energy reports that 20% of America's electricity can come from wind.

Two new ETFs were recently launched that will give investors an opportunity to invest in companies that specialize in wind:
  • First Trust Global Wind Energy (FAN)
  • Powershares Global Wind Energy Portfolio (PWND)

These ETFs are so new it's too early to identify a solid trend. However, I believe that with high oil prices and a push towards to clean energy there is potential that WIND will soon be a trend. Add these funds to your watch list and see what happens as the Pickens Plan gains momentum.

Friday, July 18, 2008

Have Financials Hit Bottom?

The trend in financials has clearly been down for the past 12 months. You may be wondering if financials have finally hit bottom after seeing positive reports from Wells Fargo and JP Morgan lift financial shares this week. If we believe Bridgewater Associates, then the short answer is probably not yet. John Mauldin's most recent letter reported that Bridgewater warns that bank losses from the worldwide credit crisis may reach $1.6 trillion. This is four times official estimates and means that at least another $1.1 trillion of losses that will have to be written off by financial institutions all over the world.

For trend followers it's too early to tell if we've hit bottom. Trend followers don't predict or time the changes in the market. Trend followers specialize in IDENTIFYING the trend and investing with it. So, let's take a look at a few charts to see what we can find.

First, we have a 3-year weekly chart of XLF, the Finacial Sector ETF:

  • Notice that we have had a declining trend since last July when the price dropped through the 40-week moving average. This was a definite red flag and a signal of danger ahead.

  • The fund is now down 42% over the last 12 months.

Now let's look at at a daily chart of the recent price action of XLF:


  • Notice the sharp rise created by this week's price action.
  • RSI and MACD have both turned up.
  • The price is still below the 50-day moving average.

Conclusion: Don't try to predict the bottom or time the turn in financials. Somewhere ahead lies a great opportunity to invest in financials. But, trend followers should be patient. Remember that trends often last longer than you think. Many thought the worst was over for financials after the Bear Stearns bailout in May. As Bridgewater reports, it could get worse before it gets better. Wait until a bottom can be identified along with a rising trend before investing. Things to look for:

  • The first sign of a new trend will be when the price crosses the 50 day moving average.
  • For a long-term trend to be established you want to see prices above the 200 day (40 week) moving average. When you see this you may then want to consider following this trend. This will provide confidence that the bottom has been established and a new trend is in force.

Wednesday, July 16, 2008

It's Time To Abolish The Estate Tax: PERMANENTLY

Today's Wall Street Journal (WSJ) included an article about the owner's of the Pittsburgh Steelers and their looming estate tax problem. The Steeler's have been owned by the Rooney family since 1933. The value of the franchise is now estimated to be over $700 million. The five sons of the original owner are now all in or approaching their 70's. Together they control 80% of the business.

The problem is the 45% federal estate tax that will put them each on the hook with the IRS for tens of millions of dollars at their death. Since the value of their estate is locked up in their business, that simply might be more than they can afford. For instance, let's assume each brother's share of the business is worth $100 million. At death each of them would have to have $45 million in cash just to pay the estate tax! In other words, the business has to be sold just to generate the cash to pay the death tax.

This is absurd! Why do we punish those who are successful? Why do we allow the government to enforce taxes that separate families from their businesses? As noted in the WSJ's article it's not just the future generations of families that suffer; when families are forced to sell businesses the community often loses out too.

You might be thinking: "Oh, why should I care? I'll never have a family business worth $700 million to worry about." Well, maybe not. But, the estate tax threatens more people than you think. In fact, it threatens families all around us. Right here in Northwest Ohio many families have worked hard for generations to acquire land and equipment in order to devleop successful farming enterprises. The estate tax is especially threatening for these families. Such operations may be worth several million dollars when the value of land, livestock, buildings, and equipment are considered. Yet when the owner dies, the next generation often does not have liquid cash to pay the tax bill. As a result, all or part of the family business may be sold to pay the IRS. This doesn't just happen with farms, but with small businesses everywhere around you.

I agree with Gary Harpst. In his book, Six Disciplines for Excellence, he states that he believes that small business owners truly are heroes. So why do we punish these entrepreneurs who have worked hard to build a business of substantial value? The government taxes us all of our lives and then if we are fortunate enough to have built wealth to pass on to future generations they tax that too! It's time for politicians to develop solutions that work! The estate tax is a nightmare to the American Dream.

By the way: Take a look at another article in today's WSJ to see where all this tax money goes. Answer: government bailouts!

For further reading on abolishing the estate tax:

Tuesday, July 15, 2008

2008 Morningstar Investment Conference

At the end of June my business partner, Tony, and I attended the Morningstar Investment Conference. The conference was a 3-day event in Chicago that attracts many great minds in the investment business. You can visit Morningstar's online coverage of the conference here.

My favorite session was lunch on Thursday. (Maybe it had something to do with the food?) The speaker was Jason Zweig. Jason shared some insights from his recent book, Your Money & Your Brain. As you can guess by the title of the book his talk focused on what happens inside our brains when we think about money. Jason's talk was both entertaining and enlightening. I haven't read his book yet, but his talk left me wanting to learn more. I recently discovered that a firm I admire greatly (Davis Advisors) has made the book required reading for all of their investment analysts. If someone like Chris requires his staff to read a book then I've got to read it.

I also enjoyed listening to Bruce Berkowitz. Bruce runs the Fairholme Fund (FAIRX), and he does a nice job for investors. My favorite quote by Mr. Berkowitz: "These are the times when seeds of great performance are planted." I couldn't agree more.

For more details on the conference, don't forget to visit Morningstar.com for links to articles, blog posts, and videos. You can also find additional web coverage at ModerGraham.com:

Wednesday, July 2, 2008

Oil Surge Continues

Crude oil futures rose to a new record above $143 a barrel today.

So what does this mean for investors? Well, to start with, it is creating some major PAIN for US stock investors as rising oil prices have now sent the Dow Jones Industrial Average over 20% below its peak of 14,164 last October. Today the Dow closed at 11,215. The Dow is now technically in bear market territory, defined as a decline of 20% or more.

Compare the daily charts of oil and the DJIA for the past year below:

OIL:

  • Today's close is a new record.
  • The price of oil has more than doubled since last September.
  • Oil has been surging since March.
  • The price of oil is well above its 200 day moving average of 103.39 and its 50 day moving average of 128.75. We can clearly identify that oil is in a rising trend.


DJIA:

  • The Dow has plunged like a waterfall since May while oil has been surging.
  • The Dow first showed signs of weekness in its long term trend in early January when the 50 day moving average crossed over below the 200 day moving average. At the time the Dow was trading around 13,300. The long-term declining trend hasn't changed since.


So what is a trend follower to do?

The following funds will enable a trend follower to exploit the rising trend in oil prices:

Trend followers should avoid US stocks as long as oil continues to rise. Just look at the charts above to see why. However, if you are not a trend follower, but a value-oriented stockpicker there are some excellent opportunities created in market environments like this. In fact, most of the great value investors I know have made there best stock purchases during bear markets. Bear markets create excellent values. Value investors will find many opportunities to buy great businesses trading at bargain prices.

[DISCLOSURE: Some clients of Freedom Financial Solutions, LLC and Adam Zuercher's family accounts own shares of GSG.]

Friday, June 20, 2008

The Futility of Forecasting

I just finished reading this week's issue of Barron's. The cover article for this week was a midyear roundtable where Barron's interviewed 11 different market experts to get their forecast for the rest of the year.

I have alot of respect for these people and admire their work. As I was reading the article I quickly realized how many different views and opinions there are regarding the economy and investment opportunities. There is not a shortage of forecasts and predictions today. The problem is they are all different. If you pay attention to the financial media today you will see and hear opinions all across the spectrum ranging from doom-and-gloom pessimism to unbridled optimism. You will find many very intelligent people with many very different forecasts.

So who do you believe? Answer: No one. Instead, you study the market itself. To be successful, you must ignore the noise and focus on the big picture. It is easy to get distracted and overwhelmed with the amount of information and wide range of predictions today. It takes discipline to stay focused and not get distracted by the irrelevant (but often interesting) information.

So how do you make intelligent investment decisions? You study the markets to uncover the important and relevant information that will help you identify and exploit sustainable investment trends. I am referring to a careful and thorough analysis of price action, highs and lows, advances and declines, price patterns, moving averages, and trend lines.

Bottom Line: Take action based on what the market is saying...but, not based on what the expert of the week is forecasting.

Don't want to do the work yourself? That's fine. My firm can do it for you. Contact us to see how we might be able to help you.

Sunday, June 1, 2008

About Me

Professional

I am a money manager. I have been helping others manage their investments since 1999. I love my work!

I started my career working for a CPA firm. I began as an auditor and soon realized that wasn't for me. In late 1999 I began my career in the investment world as I facilitated the startup of a financial planning and investment advisory business within the CPA firm.

In 2002, I decided it was time to pursue my dream of owning my own business. That year, Tony Hixon and I co-founded Freedom Financial Solutions, LLC. Our mission is to provide wealth creation and investment management solutions that enable our clients to achieve financial freedom. We manage money for people who don't have the time, desire, or expertise to do it themselves. I am the firm's Chief Investment Officer.

Education & Designations

Location

I live and work in South Carolina. I regularly travel to our office in Ohio to meet with clients. I love technology and the internet. It enables me to connect and do business with anyone almost anywhere.

Personal

I am married to a wonderful wife, Amy. We have one fabulous daughter, Avery. I am blessed to have such a great family. I love my family more than my work!

Interests

  • Faith
  • Family
  • Food
  • Investing
  • Music
  • Ohio State Football
  • Reading
  • Sporting Events (especially football and basketball)
  • Technology & the Internet
  • The Beach!
  • Triathlon Training

Social Networks

Connect with me. You can find me on:

Contact Me