Over the last 3 months health care stocks have offered a cure for the sick stock market. The chart below (courtesy of FINVIZ.com) shows that the health care sector has been the only sector to offer positive returns for the past 3 months.

The next chart compares the Health Care SPDR (XLV) with the S&P 500 SPDR (SPY) over the last 3 months.
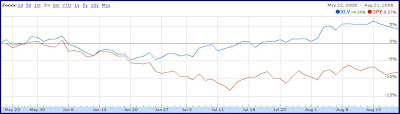 The health care sector has clearly outperformed the broad market with a positive return for XLV of 4.3% versus a negative return for SPY of -8.3%. In other words, the health care sector ETF has outperformed the S&P 500 ETF by 12.6% over the last 3 months.
As I like to say, "There's always a bull market somewhere!" These days, it has admittedly been a challenge to find an abundance of bullish trends as the market has been rather choppy lately.
Take another look at the chart above. You will see that most of the gains in health care have been generated since late July. Let's take a look at a 1-year weekly chart of XLV:

- As indicated by the blue trend line, XLV started rising in July. The price crossed both the 10-week and the 40-week moving averages by early August.
- The volume has been strong. We saw price increases on rising volume in four out of the last nine weeks. Seven out of nine weeks were positive, and the two weeks with price declines have shown volume lower than the previous weeks. All of this points to a rising trend with healthy volume.
Now take a look at the daily chart for XLV:

- This week we have seen some selling on higher than average volume. The price has pulled back a little bit, but remains above both the 50-day and 200-day moving averages.
THE UPSHOT: Health care is in the beginning stages of a bull market. Is the the trend sustainable? Will it continue? Trend followers always take the position that a trend is your friend until proven otherwise. In other words, I don't know what the future will bring. However, I can identify trends that are present today. Since trends always last longer than you think, you should operate on the assumption that a trend will continue until proven otherwise. You must look for bullish indicators and signs that the trend will continue. Be cautious when you see signs that a trend might be close to reversing. The key going forward for the health care ETF (XLV) will be the July trend line and the 40-week moving average. Today it is testing it's July trend line as well as the 40-week moving average. Look for the 40-week moving average to act as support for this trend to continue. If the price bounces off the trend line and the 40-week moving average this would be another sign of a bullish trend with the potential to be sustainable.
[DISCLOSURE: Some clients of Freedom Financial Solutions, LLC and/or Adam Zuercher's family accounts own shares of XLV.]


No comments:
Post a Comment