Each weekly chart will show the price and volume action along with the 10-week and 40-week moving averages. For this review I will analyze each sector long-term trend by identifying where the price is in relation to the 40-week moving average which acts as a long term trend line.
Financials (XLF)

- -27.2% YTD
- TREND = DOWN. Financials, by far, have been the worst performing sector in the market this year. The primary trend for financials remains firmly down. I don't expect a trend reversal anytime soon. See my previous post for a deeper review on financials, and the signs I will look for to turn bullish.

- -13.42% YTD
- TREND = DOWN. Energy stocks had a nice run until the end of June. The surge in the price of oil certainly contributed to that. However, after peaking, oil has plunged and energy stocks are currently in a down trend. The price is below both the 10-week and 40-week moving average. The 10-week average recently crossed below the 40-week which is a bearish signal.

- -7.58% YTD
- TREND = DOWN. XLY is actually trading slightly above the 10-week moving average which makes it a rising trend on an intermediate time frame. However, it's still trading below the 40-week moving average which was a point of resistance in April. Consumer Discretionary typically underperforms during weak economic environments, so I have no reason the trend will reverse anytime soon.
Technology (XLK)

- -19.28% YTD
- TREND = DOWN. Technology stocks had a powerful run from mid-2006 to the end of 2007. XLK turned bearish at the beginning of the this year, and the trend failed to reverse when the 10-week moving average failed to cross above the 40-week moving average this summer.

- -9.32% YTD
- TREND = NEUTRAL, BUT TURNING BEARISH. XLV fell below the 40-week moving average just today. Health care stocks were leaders of the market in July and August, but have struggled more recently. In fact, it seems that XLV turned down right after my previous post highlighting the strength of the sector. Perhaps some of the political risk is now weighing on the group as we approach November. This sector should be watched closely over the next few days to see if the trend is truly reversing, or if the 40-week moving average will act as support.

- -10.84% YTD
- TREND = DOWN. Materials stocks turned down this summer after a powerful bull market that began in late 2005.

- -13.76% YTD
- TREND = DOWN.

- -2.57% YTD
- TREND = UP. Consumer Staples stocks have shown resilience as they have provided the best return relative to other sectors for the year. This is to be expected during recessionary times or periods where the economy has slowed. A quick review of the top 10 holdings of XLP (see table below) provides a good explanation for the relative strength of this sector: Even during an economic slowdown consumers will still buy deodorant (thankfully!), shampoo, toothpaste, razors, coffee, food, cigarettes, soft drinks, pharmaceutical products, beer, and snacks.

Telecom (TTH)

- -23.62% YTD
- TREND = DOWN.

- -14.6% YTD
- TREND = DOWN.
THE UPSHOT: The US stock market has offered no where to hide this year as every sector has negative year-to-date returns. The only sector where we can identify an UP trend is in Consumer Staples (XLP). Health Care (XLV) is now on WATCH as it was recently in an UP trend but now appears that it is turning DOWN. I believe that there is always a bull market somewhere! The first half of this year, the bull market was in oil, commodities, and precious metals. In July and August the bull market was in health care. This year the bull market has been in short or inverse ETFs. Sometimes the bull market is cash. Cash is king during environments like this where money is rotating between sectors and asset classes. New trends are forming and somewhere ahead we will identify some amazing new bull markets. Cash will enable you to jump on these new trends very quickly once the transition is complete.
[DISCLOSURE: Some clients of Freedom Financial Solutions, LLC and/or Adam Zuercher's family accounts own shares of XLV and XLP.]


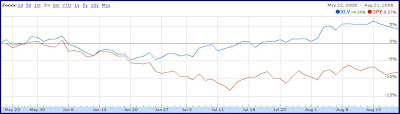 The health care sector has clearly outperformed the broad market with a positive return for XLV of 4.3% versus a negative return for SPY of -8.3%. In other words, the health care sector ETF has outperformed the S&P 500 ETF by 12.6% over the last 3 months.


